
Most GEO reports hand you 1 number and call it visibility. You approve it because there’s nothing to check it against, and 3 months later you still can’t tell if any of the work moved.
Quick Answer: Real GEO reporting breaks that 1 number into 6 layers: citation type, share of voice, source mix, AI-referred traffic, technical health, and business outcome. Each layer is tracked as a trend across repeated runs, not a single score.
Ask for this exact breakdown before you accept your next report. A blended score can’t be checked against anything.
Key Takeaways
- A citation count alone can’t show whether your brand was the named recommendation or just background evidence. Treating those as 1 number is the most common shortcut in GEO reporting today.
- A real report tracks citation stability too: how many of 5 repeated runs on the same prompt actually produced the citation, not just whether it happened once.
- Off-site citations decay. A community-platform mention counted last quarter can be deleted or edited by the time you read this quarter’s report, and almost no report rechecks that.
- The counting method itself can quietly change between reports. Ask what changed in the methodology before you trust a jump in the numbers.
- Monthly is the right cadence for most reporting. Weekly mostly shows the platform’s own noise, not your progress.
- 1 combined score, no raw data, and no competitor row is the fastest way to spot a vanity dashboard.
Why Traffic and Citation Counts Alone Don’t Prove Anything
Traffic and citation counts are the 2 numbers almost every GEO report leads with. Both are real signals. Neither, alone, proves the work is paying off.
1. A citation count blends 2 very different outcomes
We split every citation into 3 outcomes before totaling anything: cited as evidence, cited as a named option, or misrepresented and omitted.
A page that only supports a general AI answer, and a page that names your brand as the actual recommendation, both count as “1 citation” on a report that only tracks volume.
2. Traffic alone misses the reader who never clicked
Most people who see your brand named inside a ChatGPT or Perplexity answer never generate a session your analytics can log. A dedicated AI-referral channel in GA4 catches part of that.
It still can’t count the reader who got a complete answer and never clicked. That reader is often the exact outcome a GEO program was aiming for.
3. A single score hides which layer actually moved
A composite score usually blends citation frequency, placement, and sentiment into 1 figure, which is easy to skim and hard to act on.
| What Moved | A Composite Score Shows | A Real Report Shows Instead |
|---|---|---|
| More evidence citations, 0 new named-option citations | Score goes up | Named-option rate flat, the metric that matters most |
| A competitor lost visibility, you gained none | Score goes up | Share of voice flat while the field shrank |
A composite score can rise for reasons that have nothing to do with your own performance. Reporting the layers separately is the only way to tell which 1 actually moved.
The GEO Reporting Stack: 6 Layers a Real Report Has to Show
We report GEO work across 6 layers every period, not 1 blended number.
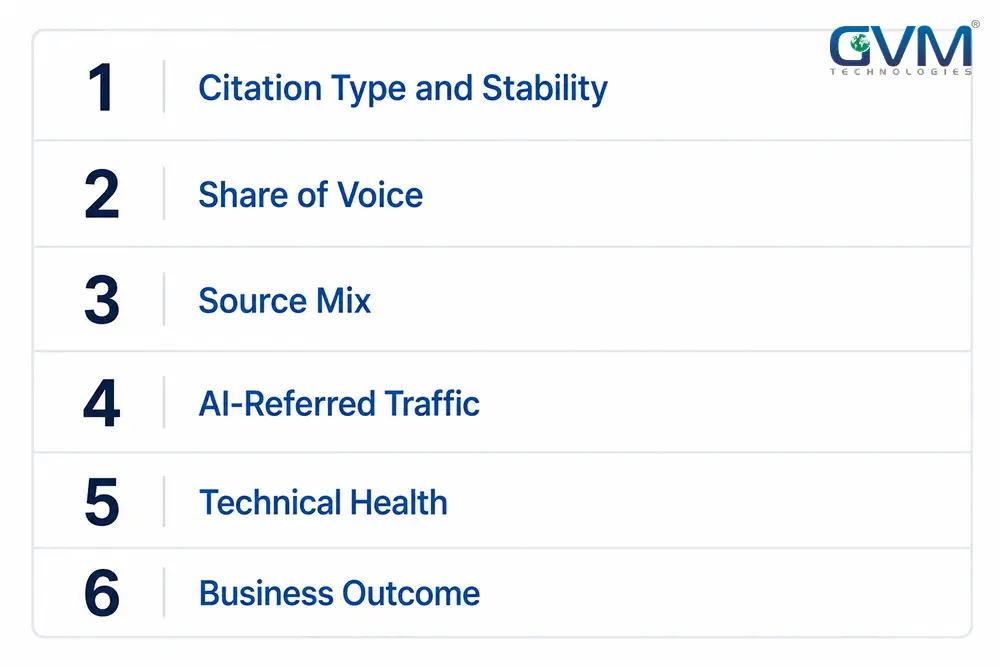
1. Citation type and stability, not a single count
Report a rate for each of the 3 outcomes above, run across the same buyer questions every period.
Then add a stability figure. A brand cited 5 out of 5 runs is a stronger, more repeatable result than a brand cited once and never again, even though both count as “1 citation” on a simpler report.
2. Share of voice against named competitors
Your citation count alone can’t show whether you’re winning the category or losing it. Share of voice, your citations as a share of all citations across the same prompt set including named competitors, is what actually shows competitive position.
3. Source mix, and whether it still holds
We consistently see large discussion platforms and professional networks cited more often than most brands’ own websites on comparison questions. The mix also shifts by platform:
- Perplexity leans harder on community and forum-style sources.
- Claude leans harder on long-form articles and documentation pages.
- Gemini leans harder on news and editorial sources.
A report should show this split, and it should recheck whether last period’s off-site citations still exist.
Community posts get deleted, edited, or archived. A citation your report counted 3 months ago may already point at nothing.
4. AI-referred traffic, tracked and named correctly
Google Analytics, Search Console, and a citation tracker can each label the same AI platform differently. That quietly splits 1 real traffic source into 2 or 3 smaller-looking ones.
We build a standardized AI-referral channel into every client’s analytics setup to fix this.
A detail most reports miss: when Google’s AI Overviews send a click, the destination URL can carry a #:~:text= fragment. A GA4 dimension built to catch that fragment recovers sessions that would otherwise land in “Direct.”
Search Console now has its own dedicated report for AI-generated features. Check it alongside GA4 instead of relying on 1 source alone.
5. Technical health underneath the numbers
A citation-rate drop can mean your content weakened. It can also mean an AI crawler lost access entirely, which a real report checks for directly:
- Confirming robots.txt still allows GPTBot, ClaudeBot, and PerplexityBot
- Checking Bing indexation
- Flagging any page that only renders after JavaScript executes
These checks belong inside the report itself, not a separate audit nobody reads.
6. The business outcome the numbers are supposed to explain
Citation rate, share of voice, and traffic are leading indicators. A real report ties them to leads where tracking allows it, and says so plainly when a number is directional rather than proven revenue.
| Layer | A Real Report Shows | A Vanity Dashboard Shows |
|---|---|---|
| Citation type and stability | Evidence, named option, omitted, plus a run-stability rate | 1 total “mentions” count |
| Share of voice | Your rate next to named competitors | Your number shown alone |
| Source mix | On-site vs. third-party, rechecked for durability | No breakdown, no recheck |
| AI-referred traffic | A standardized channel, #:~:text= sessions recovered |
Buried inside “Direct” |
| Technical health | Crawler access confirmed each period | Assumed, never rechecked |
| Business outcome | Tied to leads where tracking allows, labeled honestly | Not mentioned |
Why the Same GEO Report Can Look Different a Month Later
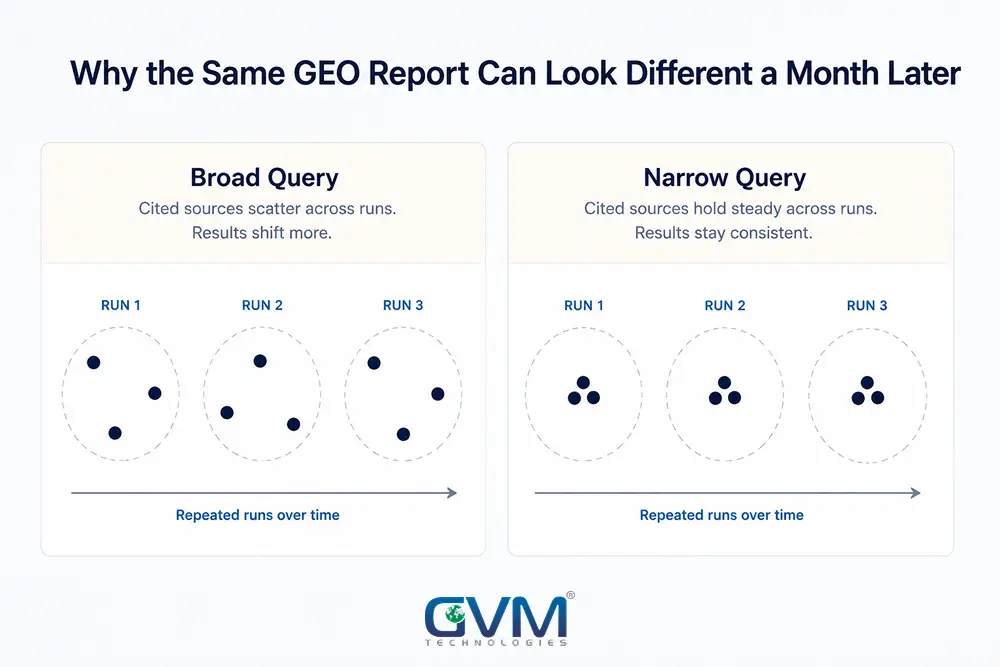
An AI platform’s answer to the same prompt isn’t fixed. The same question, run twice, can surface a different cited source, because the system retrieves and synthesizes at the moment it’s asked.
- Broad, high-competition questions (“best SEO agency”) see their cited sources shift often between runs.
- Narrow, specific buyer questions (“SEO agency for a 12-person law firm”) hold steadier across the same runs.
That’s why we sample each prompt more than once per period and report the pattern, not a single run. Weekly reporting mostly captures that noise; monthly cadence gives real changes enough time to show a repeatable pattern.
Watch for this: ask whether the counting method changed between 2 reports. A broader citation-type definition, or a different run count per prompt, can double a number with 0 real change in visibility.
Your first report should be measured against a dated baseline built the same way, every time.
What a Real GEO Report Actually Contains
| Report Section | Should Contain | Common Shortcut |
|---|---|---|
| Summary | 1 short, outcome-focused paragraph | A wall of jargon, no takeaway |
| The 6-layer breakdown | All 6 layers from above | Only 1 or 2 layers shown |
| Citation examples | Real, dated screenshots | Old, unlabeled screenshots |
| Competitor comparison | Named competitors, same prompts | Your numbers shown alone |
| Technical health check | Crawler access confirmed this period | Skipped, or a 1-time note |
| Next-period priorities | 3 to 5 specific, ranked actions | Generic “continue optimizing” |
A report clearing every row is worth trusting. Missing 3 or more rows is closer to a sales aid than measurement.
Red Flags That Mean You’re Getting a Vanity Report
| Red Flag | What It Actually Means |
|---|---|
| 1 combined score, nothing else | You can’t tell which layer moved |
| No raw, per-prompt data on request | The summary chart is a claim, not evidence |
| No named competitor shown | You can’t tell if you’re winning or the category shrank |
| Off-site citations never rechecked | Some of your “wins” may already be dead links |
| Counting method changes, unexplained | A number can double with no real visibility gain |
| Guaranteed improvement attached | No agency, including us, controls a probabilistic system closely enough to promise that |
2 or more of these in the same report is worth a direct conversation with whoever sent it. We run this exact checklist before taking over reporting for any new client.
How to Read Your Own GEO Report in Under 10 Minutes
- Check the date range and named platforms. It should name each platform tested, not “AI platforms” as a category.
- Find the citation-type breakdown. If every citation is lumped into 1 number, ask for the evidence-versus-named-option split.
- Look for a stability figure. A citation that showed up once in 5 runs is not the same win as 1 that showed up in all 5.
- Find the competitor row. A number with no comparison point tells you almost nothing.
- Re-run 1 stable citation on a broader version of the same question. If it disappears the moment real competitors enter the query, you were winning an empty room, not a real moat.
A report clearing all 5 checks in under 10 minutes is doing its job.
Conclusion
The 1-line test for any GEO report in your inbox: does it show 6 layers, or 1 blended score?
A real GEO report breaks citations into what they mean, checks whether they’re still standing, and benchmarks you against named competitors. It ties AI-referred traffic to real sessions and connects all of it to a business outcome, honestly labeled.
GVM Technologies builds every client’s report this way, starting from a dated baseline before we bill a single hour.
Every layer is shown side by side on a monthly cadence, never blended into 1 figure.
Book a Free Strategy Call and see a sample 6-layer report for your industry before you commit to anything.
If a vague “visibility score” is all you’ve ever been shown, this is the exact gap hiding your real results.
FAQs
1. What should a real GEO report include every month?
At minimum, a real report includes:
- A citation-type and stability breakdown
- Share of voice against named competitors
- A source-mix check that also rechecks durability
- Standardized AI-referred traffic
- A technical health check
- A business-outcome section, labeled leading or confirmed
2. How is GEO reporting different from SEO reporting?
SEO reporting tracks a comparatively stable ranking position. GEO reporting tracks a probabilistic system’s citation behavior across repeated runs, so the same prompt can return a different result each time it runs.
Google’s own guidance confirms AI features run on the same core ranking systems as standard Search.
A real GEO report explains a citation instead of presenting the count as a fixed rank.
3. Why did my citation count drop even though nothing changed on my site?
3 explanations are common:
- Normal run-to-run variation
- A shift in the AI platform’s own sources
- A technical access problem, like a blocked crawler or a JavaScript-only page
A real report distinguishes between these instead of just showing the drop.
4. Is a higher citation count always better?
No. A citation counted as background evidence and a citation naming your brand as the recommendation are different business outcomes. A rising total made up entirely of evidence citations isn’t the same as real progress.
5. What does a real GEO reporting engagement actually cost?
Pricing varies by scope. Our own published tiers run from $99 a week for a starter engagement up to $349 a week for advanced multi-platform coverage, with custom enterprise scoping above that.
Reporting is built into every tier, never billed as a separate line item.
6. How often should GEO be reported, weekly or monthly?
Monthly is the right default for most businesses. Weekly numbers mostly reflect ordinary run-to-run volatility rather than real movement, so they usually read as noisier without being more useful.
7. What’s the difference between a citation and a mention?
A citation is a specific reference an AI system makes to a source while generating an answer. A mention is any appearance of your brand name in that answer, cited or not, and the 2 numbers can move in different directions.